Farmland biodiversity is determined by habitat, species and genetic diversity. Due to its complexity, biodiversity cannot be measured as such, and it is assumed that no single all-inclusive index for biodiversity can be devised. Ideally, indicators represent biodiversity as a whole AND are sensitive to environmental conditions resulting from e.g. land use and agricultural management practices.
Scientific testing and the subsequent stakeholder audit yielded a complementary set of 23 indicators with minimum redundancies within the components of habitat-, species- and genetic (livestock, crops) diversity as well as farm management indicators. Whereas 16 indicators are relevant for all farm types (field crops and horticulture, specialist grazing livestock, mixed crops-livestock, permanent crops), seven apply only to specific farm types.
Contact
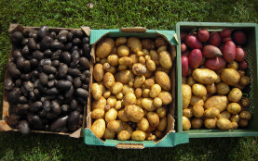
Indicators for genetic diversity
Genetic variability is the basis of life. Farmers and breeders have developed a multitude of crop varieties and animal breeds to suit their needs, and to stabilise and increase productivity. Information on livestock breeds and crop cultivars used on each farm was tested as a surrogate for genetic diversity. These tools are very simple, addressing neither diversity on the gene level nor environmental influence. Molecular genetic methods are technologically demanding, expensive, and require further development for general application. Therefore, three simple indicators based on crop-cultivar and livestock-breed information collected in farmer interviews are proposed to assess genetic resources of crops and livestock.
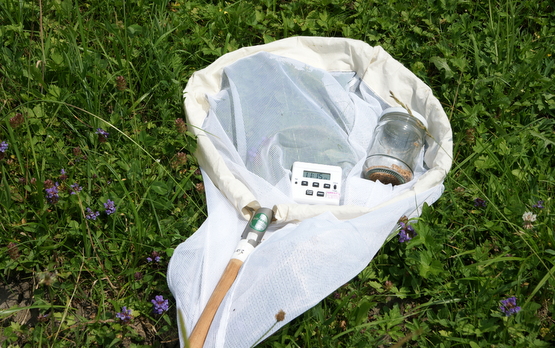
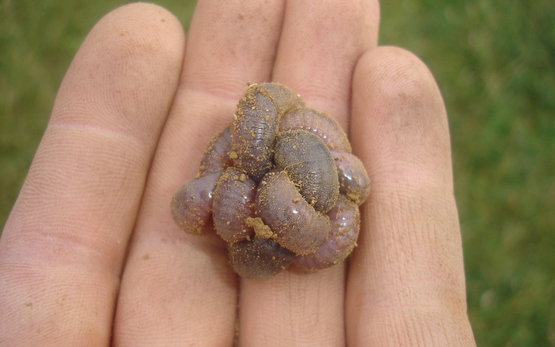
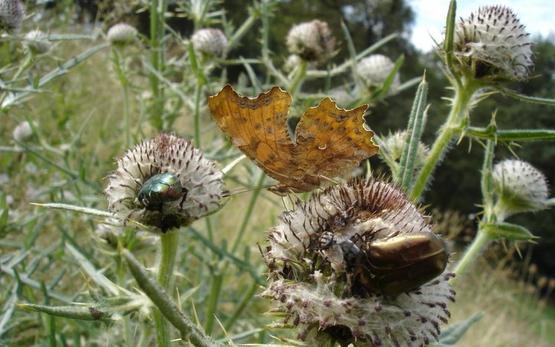
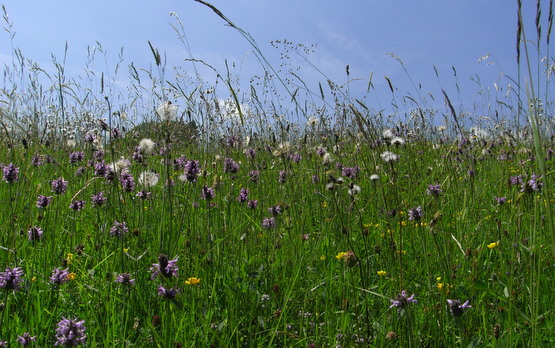
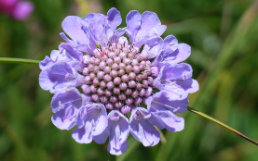
The BioBio species diversity indicators operate at local to intermediate scales and cover the four major ecological functions which are relevant for farming: Primary production (plants), degradation of organic material (earthworms), pollination (wild bees and bumblebees), predation (spiders). The emphasis on invertebrates, in addition to vascular plants, reflects the contribution of invertebrates to overall species diversity, arthropods alone making up about 65% of the species number of all multicellular organisms. Moreover, they are relatively easy to monitor, provide relevant information on general environmental conditions, include emblematic species, react quickly to environmental changes, and substantial datasets are available in various European countries.
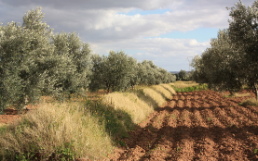
BioBio proposes a system for classifying the farm habitats. Common lands, forest and aquatic habitats not used for agricultural purposes, and urban habitats are excluded. The farm area is subdivided into (1) Intensively farmed land, including all crop fields and grasslands managed for the primary purpose of agricultural production, and (2) Semi-natural habitats. Both categories are then subdivided, depending on the presence of trees. Aquatic habitats are classified as semi-natural. Habitat diversity indicators are obtained via habitat mapping at farm scale.
TreeHab: Tree Habitats (PDF, 875 kB, 02.02.2022)Relates to fruit trees, ornamental trees, vines and pastured forest as well as to hedgerows and semi-natural woodland elements on Utilised Aricultural Area (UAA)
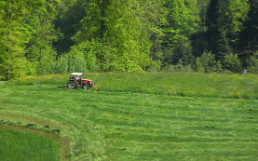
Auch die Bewirtschaftungsart beeinflusst die Biodiversität eines Landwirtschaftsbetriebs. Es wurden acht Bewirtschaftungsindikatoren ausgewählt, mit denen die Intensität der Bewirtschaftung erfasst und mit den direkten Indikatoren zu Habitaten und Arten in Zusammenhang gesetzt werden kann. Der Zusammenhang zwischen Bewirtschaftungsindikatoren und Indikatoren zur Artenvielfalt wird sichtbar, wenn das gesamte Spektrum der Bewirtschaftungsintensität untersucht wird. Die BioBio-Fallstudienregionen umfassen den Bereich extensiv bis mittelintensiv bewirtschafteter Betriebe. Deshalb ist dieser Zusammenhang nicht immer sehr ausgeprägt. Ausserdem waren die Korrelationen zwischen Bewirtschaftungsindikatoren und Indikatoren zur Artenvielfalt von Fallstudie zu Fallstudie unterschiedlich eng.
In jeder Fallstudie ergab die Analyse eine Korrelation zwischen einzelnen Bewirtschaftungsindikatoren und direkten Biodiversitätsindikatoren.